Currency Strength Meter Features
The currency strength meter is a powerful trading tool, designed to help you make better trades. It provides real-time and historical currency strength data across multiple time-frames.
This is a standalone App that run on Windows or macOS computers. It connects directly to a dedicated currency strength data server which provides the data you see on the charts and tables.
What is Currency Strength?
Currency strength is a unique and increasingly popular indicator used by Forex traders to make better trade decisions and find more trade opportunities.
Currency strength gives a more complete market perspective than traditional indicators by measuring the strength or weakness of individual currencies rather than currency pairs.
This technique is effective because Forex pairs are correlated by the currencies they share. Some currencies are also correlated e.g. AUD and NZD.
How is Currency Strength Calculated?
Currency strength is calculated using real-time and historical price data to measure the price movements of a large group of Forex pairs. Data from 30+ Forex pairs is used to calculate currency strength values for the 8 major world currencies for multiple timeframes.
These extensive data calculations are performed on a dedicated currency strength server. Strength is reported on a scale of 0 (weakest) to 10 (strongest).
How can currency strength improve my Forex trading?
Initially you would look for extreme strength or weakness in a particular currency and then focus your attention on trade setups involving related Forex pairs.
Currency strength can also be used to quickly identify the cause of a large move in a Forex pair.
For example, if GBP/USD is trending down following an economic news announcement (e.g., U.S. Nonfarm Payrolls), the currency strength meter would immediately indicate whether the move was due to generalized GBP weakness or USD strength.
If it was due to mostly USD strength, then you could look for trade opportunities on other USD Forex pairs.
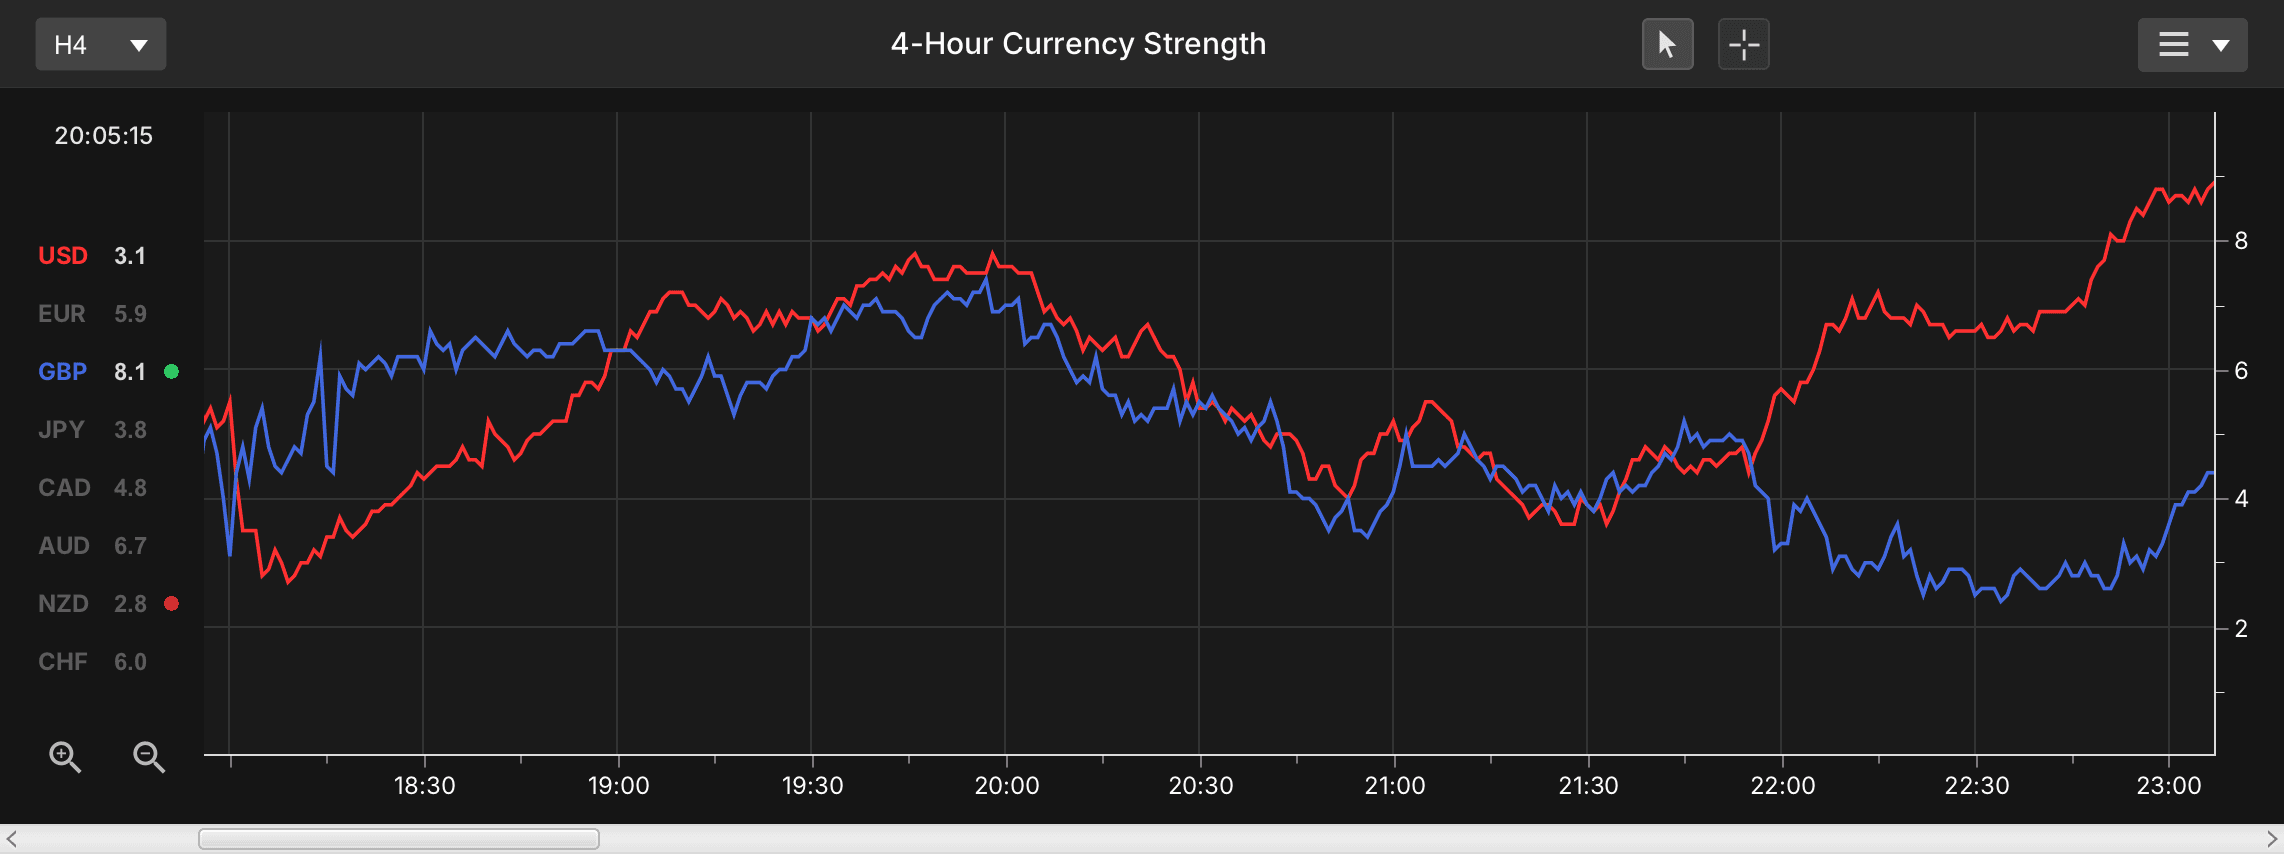
Line Charts
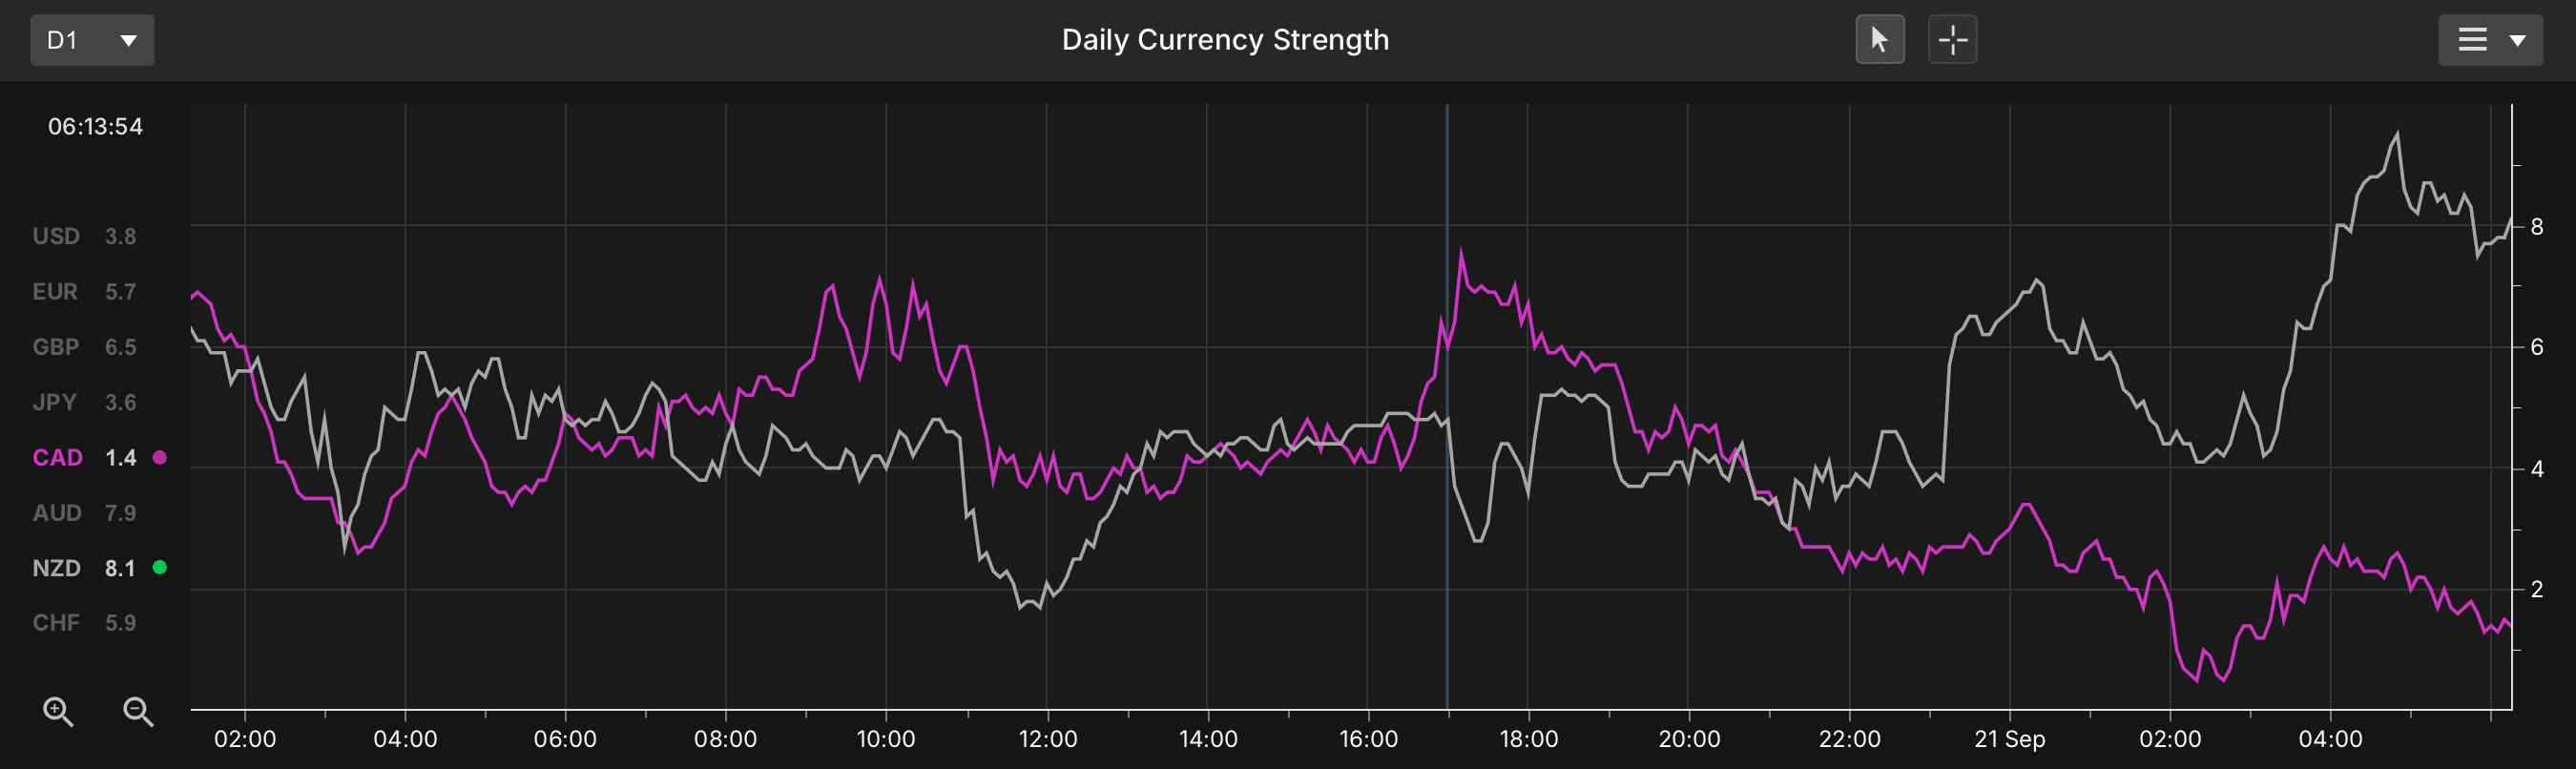
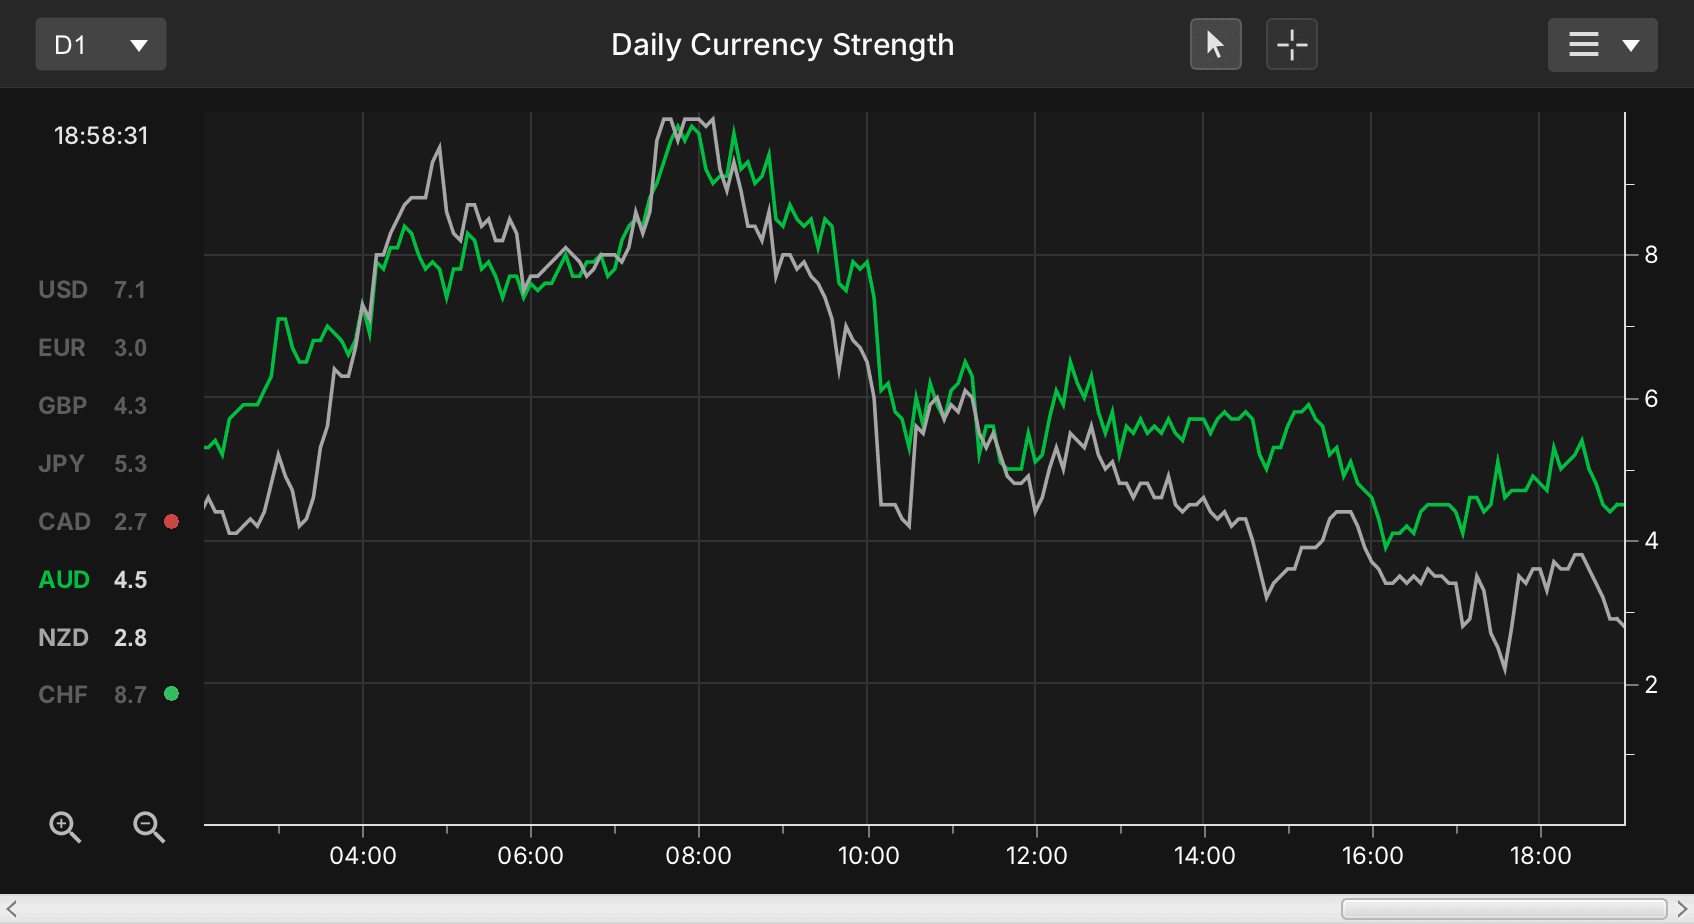
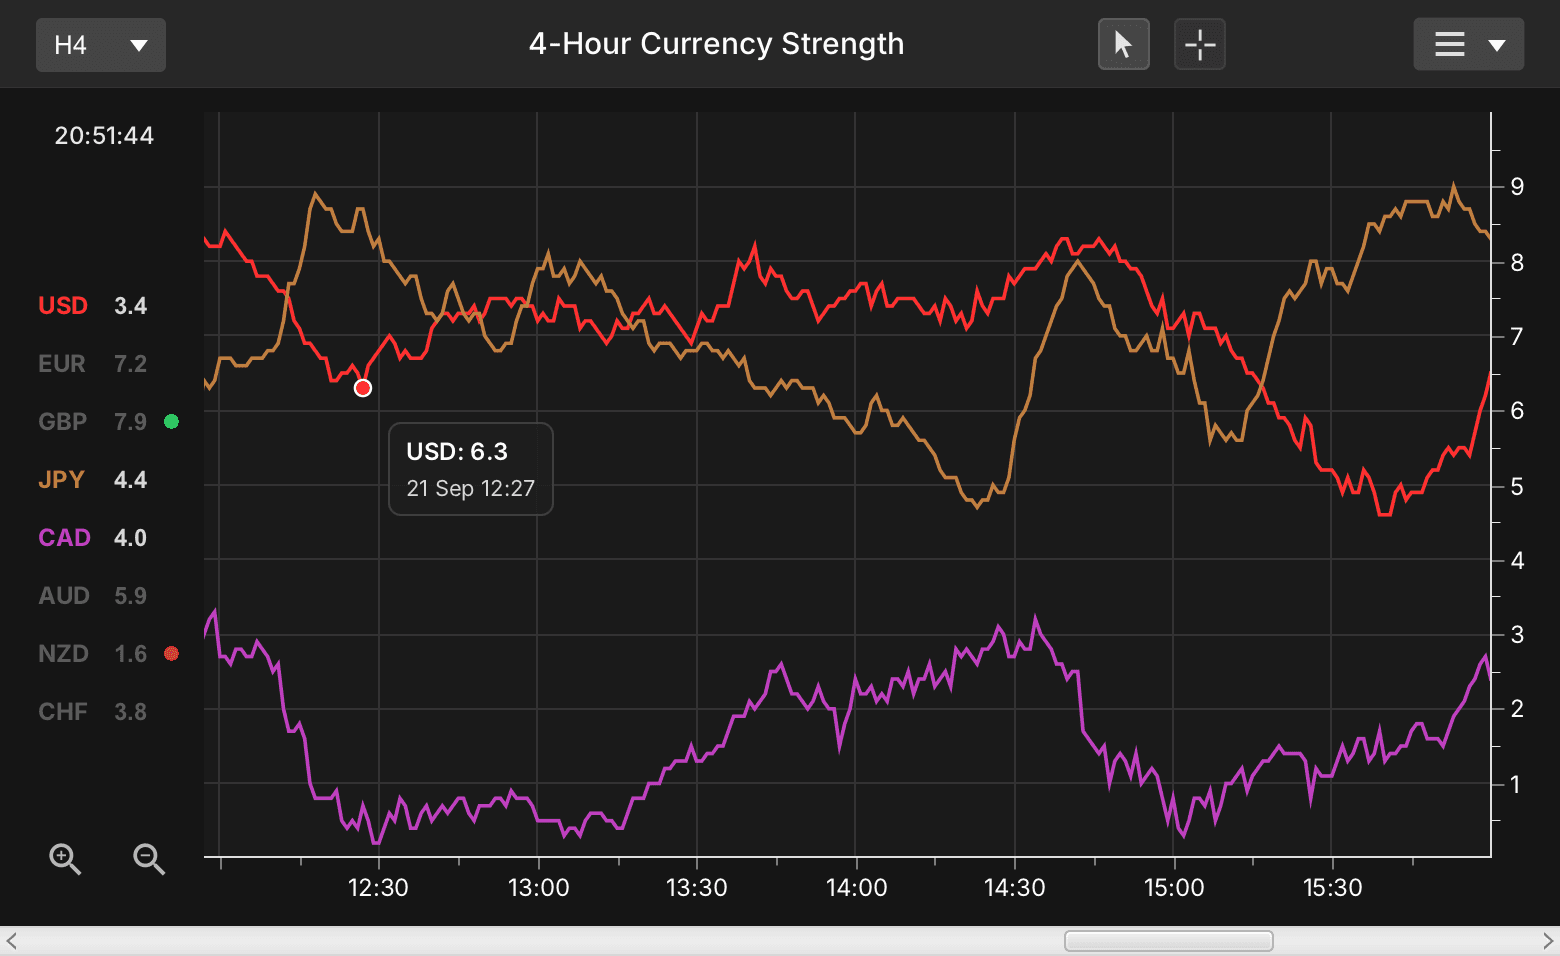
Currency strength charts are used to identify currency strength trends. They look much like a normal Forex chart, except the vertical axis is currency strength rather than price.
A chart can display up to 8 different currency strengths at once, and the timeframe is selectable.
You can open as many charts as you want, resize them, scroll and zoom, just like any normal Forex chart.
Bar Charts
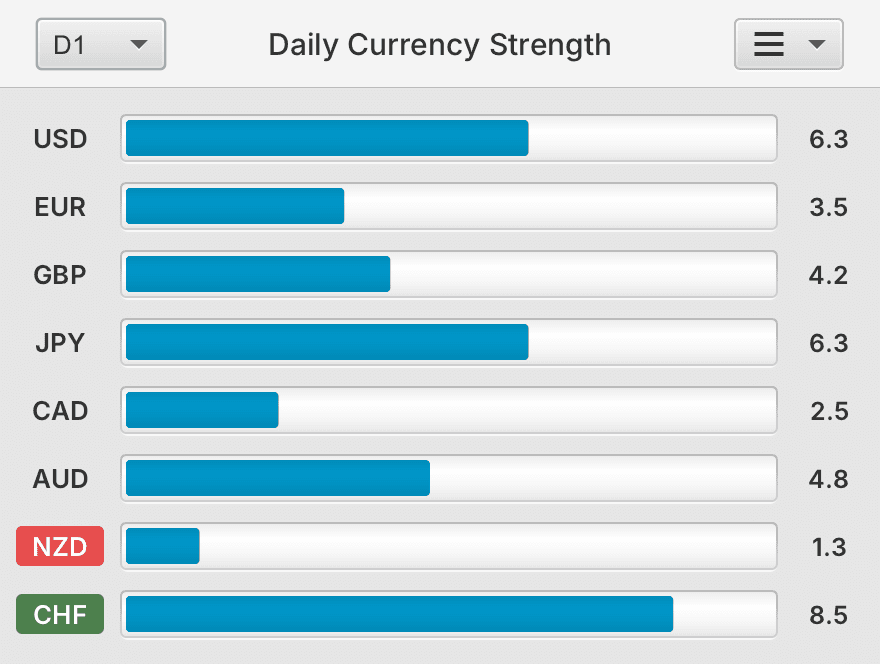
Bar charts display real-time currency strength values.
This type of chart is best suited for monitoring tick-by-tick changes in currency strength.
The strongest and weakest currencies at any given moment are highlighted.
Currency Strength Heat Map
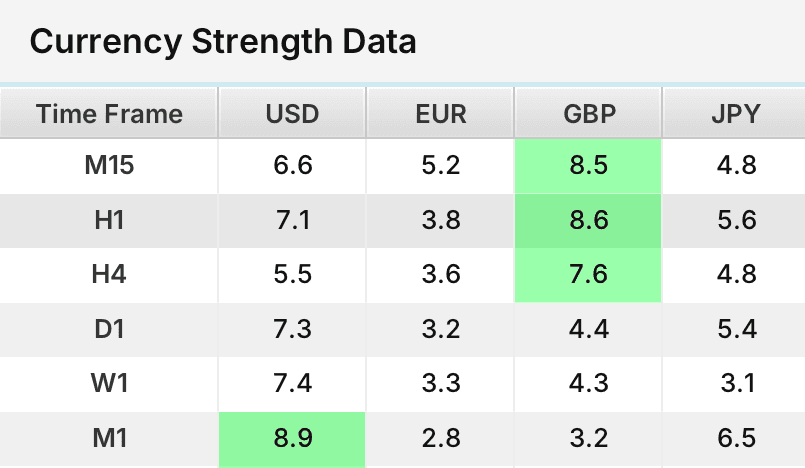
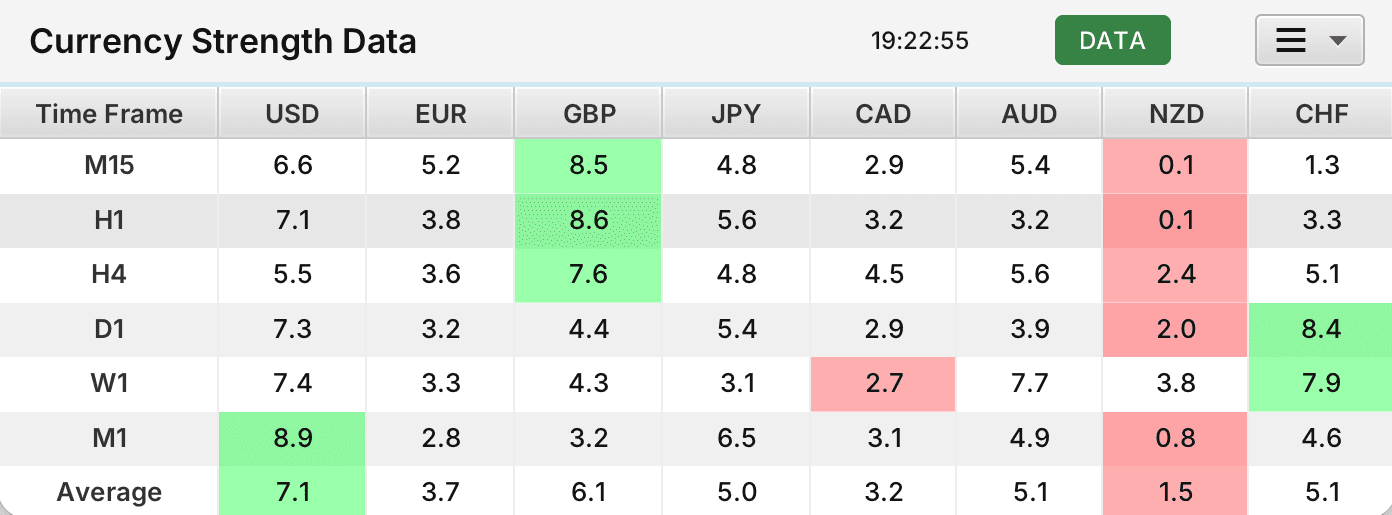
This heat map shows real-time currency strength values across all currencies and timeframes.
The strongest and weakest currency strength values for each timeframe are highlighted.
With just a quick glance, you can see which currencies are trending strongly across multiple timeframes.
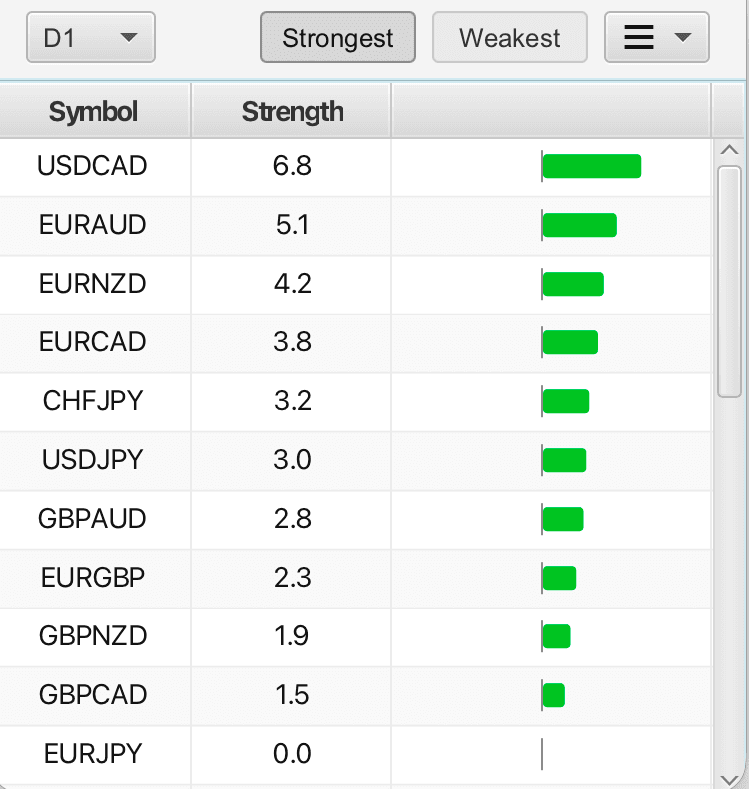
FX Pair Strength
The currency strength of each tradable Forex pair is shown in the table for the selected timeframe.
Pair strength is calculated from the difference between the strength of the individual currencies that make up the Forex pair, e.g., GBP and USD in GBP/USD.
This is particularly useful when deciding which pair to trade during a strong currency trend.
Advanced Alerts
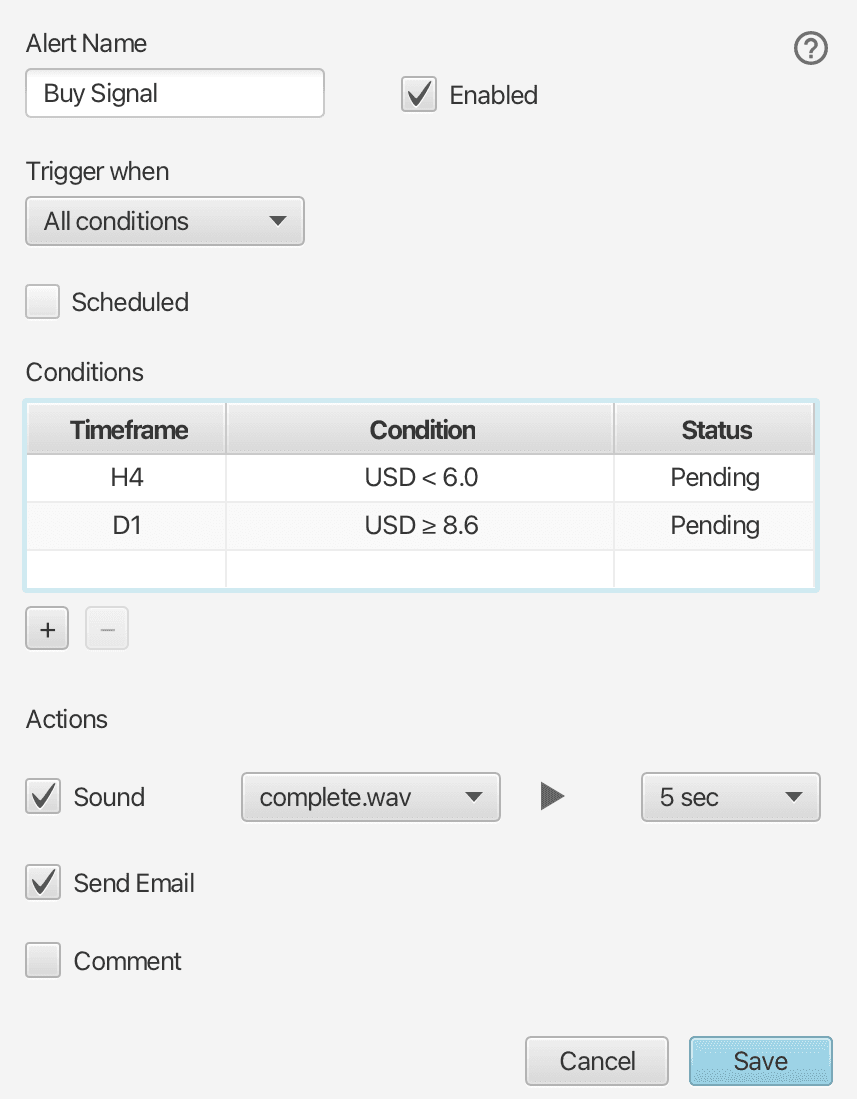
Currency strength alerts can be set for different timeframes and trigger conditions.
Multiple trigger types are supported:
- Currency value threshold
- Currency crossover
- Currency proximity
- Forex strength value threshold
An alert can have one or multiple trigger conditions. Multiple trigger conditions are ideal for detecting pullbacks, e.g., weakness on the H1 timeframe, with strength on the H4, D1 and W1 timeframes.
Your alert trigger conditions are monitored 24/7 on the data server.
Customizable
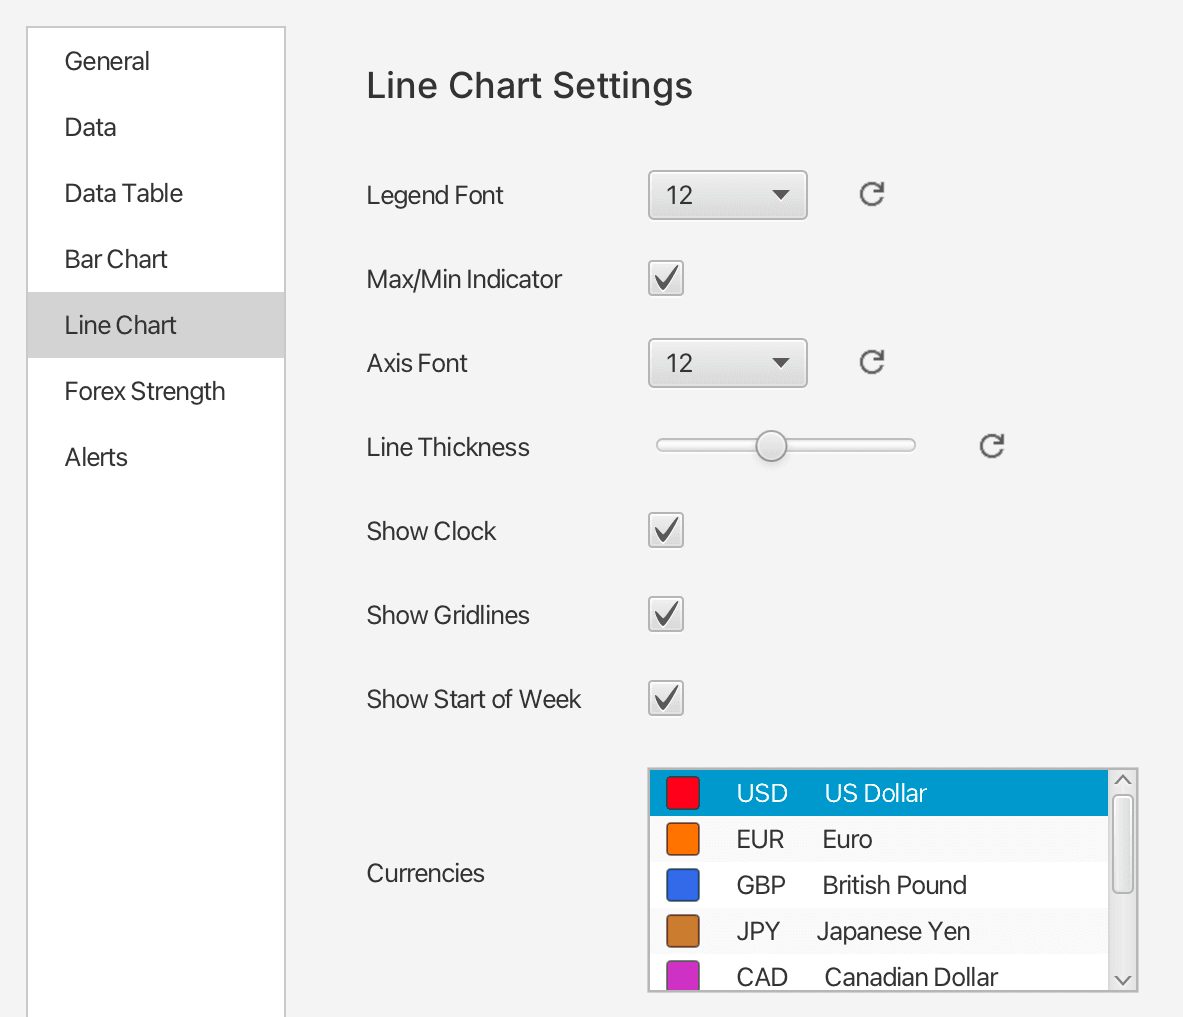
Most traders will find that the default settings don’t need to be adjusted, apart from perhaps the chart time zone or alert tone.
But we’ve provided lots of settings anyway, just in case you have a specific need, e.g., colours, fonts, alert messages, date formats, chart settings, etc.
Lots more…
There are many more features that you’ll discover, but we’ve covered the main ones here.
Feel free to contact us if you have any specific questions.